This convenience function enables the easy visualisation of
interpolated water levels stored as WaterLevelDataFrame using
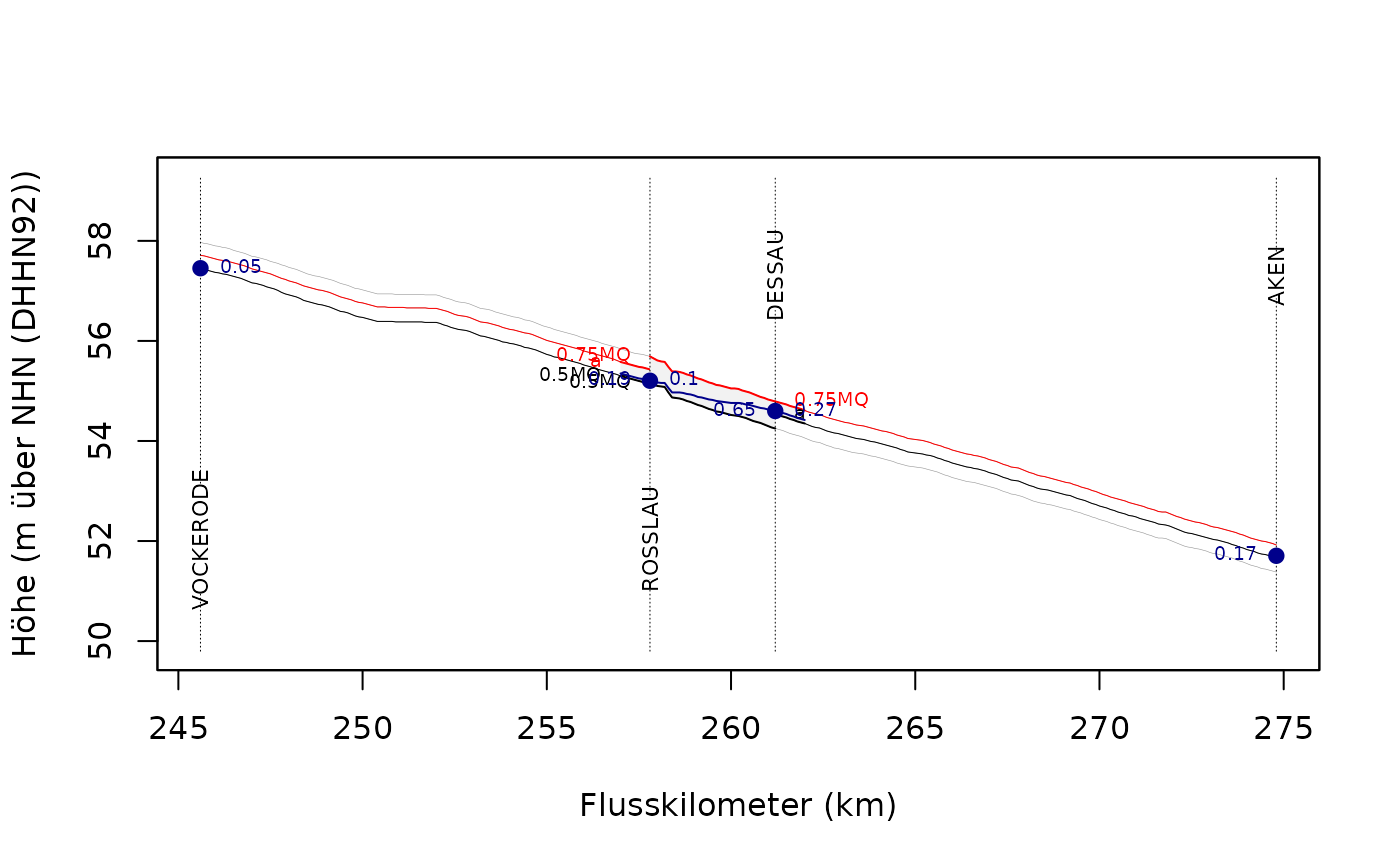
the R package shiny. The
results of functions like waterLevel and
waterLevelPegelonline can be plotted interactively so that
the computation process itself becomes visible.
Arguments
- wldf
an object of class WaterLevelDataFrame.
- add_flys
logicaldetermining whether the used FLYS3 water levels should be plotted.- add_flys_labels
logicaldetermining whether the used FLYS3 water levels should be labelled.- add_weighting
logicaldetermining whether the weighting of gauging data at the gauging stations should be labelled.- ...
further graphical parameters passed to
plot.default.
Value
A plot of a WaterLevelDataFrame.
References
Bundesanstalt für Gewässerkunde (2016). “FLYS – Flusshydrologischer Webdienst.” https://www.bafg.de/DE/5_Informiert/1_Portale_Dienste/FLYS/flys_node.html.
Examples
wldf <- WaterLevelDataFrame(river   = "Elbe",
                            time    = as.POSIXct("2016-12-21"),
                            station = seq(257, 262, 0.1))
wldf <- waterLevel(wldf, shiny = TRUE)
plotShiny(wldf, TRUE, TRUE, TRUE)